We may earn money when you click on links to our partners. Advertiser Disclosure
Women make up 56% of the labor force, and 71.7% of them are mothers of children under 18 years old. Holding a career while raising a family is like juggling two full-time jobs. On top of that, most women earn about 83% of what men earn—that’s 83 cents for every man-earned dollar.
According to Tricia Dege, Founder of Mom Mastermind, while women and mothers can make modifications to improve their work and home life, it’s important to advocate for and participate in broader changes as well.
“States can support working mothers, creating ripple effects to families and communities, through guidelines (and in some cases incentives) for parental leave, equitable pay, and both longitudinal and backup childcare options. A partnership between states and businesses to collaborate on solutions, with significant input from working mothers, will lead to the best outcome.”
B2B Reviews compared all 50 states and the District of Columbia across 16 key metrics to determine which states are best for working moms in 2024.
Best and Worst States for Working Moms
| Rank | State | State of Childcare | Job Market | Work-Life Balance & Health | Cost of Living | Total Weighted Score | Score out of 100 |
| 1 | New Hampshire | 20 | 13 | 20 | 20 | 72 | 100% |
| 2 | Maryland | 21 | 17 | 18 | 14 | 70 | 97.2% |
| 3 | South Dakota | 18 | 15 | 14 | 20 | 68 | 93.3% |
| 4 | Massachusetts | 15 | 18 | 22 | 10 | 65 | 89.3% |
| 5 | Vermont | 15 | 19 | 22 | 8 | 63 | 87.4% |
| 6 | North Dakota | 17 | 13 | 15 | 18 | 63 | 87.4% |
| 7 | Colorado | 16 | 12 | 21 | 14 | 63 | 86.3% |
| 8 | Connecticut | 17 | 12 | 19 | 14 | 62 | 85.8% |
| 9 | Oregon | 18 | 17 | 18 | 8 | 61 | 84.5% |
| 10 | Washington | 13 | 15 | 18 | 14 | 60 | 82.4% |
| 11 | Utah | 13 | 13 | 17 | 16 | 59 | 81.6% |
| 12 | Virginia | 19 | 14 | 12 | 13 | 58 | 80.4% |
| 13 | Maine | 19 | 15 | 16 | 8 | 58 | 79.9% |
| 14 | Arizona | 13 | 16 | 12 | 15 | 57 | 78.8% |
| 15 | Nebraska | 13 | 15 | 16 | 13 | 57 | 78.8% |
| 16 | Minnesota | 11 | 16 | 19 | 11 | 57 | 78.5% |
| 17 | New York | 14 | 18 | 18 | 7 | 57 | 78.4% |
| 18 | New Jersey | 13 | 13 | 18 | 11 | 56 | 77.0% |
| 19 | Rhode Island | 11 | 13 | 19 | 12 | 56 | 76.9% |
| 20 | Hawaii | 10 | 19 | 19 | 7 | 55 | 75.6% |
| 21 | Florida | 17 | 19 | 8 | 11 | 55 | 75.5% |
| 22 | Alaska | 12 | 15 | 13 | 14 | 54 | 74.5% |
| 23 | Kansas | 14 | 13 | 11 | 15 | 54 | 74.4% |
| 24 | Pennsylvania | 15 | 12 | 13 | 13 | 54 | 74.4% |
| 25 | California | 11 | 17 | 17 | 8 | 53 | 73.6% |
| 26 | Iowa | 17 | 10 | 14 | 13 | 53 | 73.3% |
| 27 | Delaware | 15 | 13 | 15 | 9 | 53 | 73.0% |
| 28 | Wisconsin | 12 | 11 | 16 | 13 | 52 | 72.2% |
| 29 | Missouri | 14 | 12 | 13 | 13 | 52 | 72.0% |
| 30 | Illinois | 11 | 12 | 15 | 14 | 52 | 71.2% |
| 31 | New Mexico | 10 | 16 | 13 | 12 | 51 | 70.6% |
| 32 | Texas | 15 | 12 | 7 | 17 | 51 | 70.5% |
| 33 | Ohio | 17 | 7 | 11 | 14 | 50 | 69.2% |
| 34 | District of Columbia | 11 | 14 | 17 | 8 | 50 | 68.8% |
| 35 | Idaho | 13 | 11 | 13 | 12 | 50 | 68.5% |
| 36 | Wyoming | 20 | 10 | 4 | 17 | 50 | 68.5% |
| 37 | Arkansas | 13 | 13 | 8 | 15 | 48 | 66.7% |
| 38 | Nevada | 10 | 15 | 8 | 15 | 48 | 66.6% |
| 39 | Georgia | 17 | 15 | 6 | 9 | 47 | 64.9% |
| 40 | Michigan | 11 | 8 | 13 | 14 | 46 | 63.2% |
| 41 | Montana | 10 | 13 | 12 | 11 | 46 | 62.9% |
| 42 | Tennessee | 9 | 15 | 9 | 13 | 45 | 62.3% |
| 43 | North Carolina | 8 | 15 | 10 | 11 | 44 | 61.1% |
| 44 | Kentucky | 15 | 9 | 6 | 14 | 44 | 60.9% |
| 45 | Oklahoma | 13 | 12 | 6 | 11 | 42 | 57.3% |
| 46 | Indiana | 11 | 8 | 7 | 15 | 41 | 57.0% |
| 47 | South Carolina | 11 | 11 | 11 | 6 | 39 | 53.8% |
| 48 | Mississippi | 13 | 8 | 3 | 8 | 32 | 44.6% |
| 49 | West Virginia | 9 | 5 | 8 | 10 | 32 | 43.7% |
| 50 | Alabama | 11 | 9 | 3 | 8 | 31 | 42.9% |
| 51 | Louisiana | 8 | 5 | 2 | 12 | 27 | 37.5% |
Note: Each column shows the total number of weighted points each state earned for that category.


Methodology
To determine the best and worst states for working mothers, our research team compared childcare, job markets, work-life balance, and living expenses for all 50 states and the District of Columbia using 16 key metrics, which are listed below with their corresponding weights.
Metrics that had a greater impact on reducing financial burdens and increasing time with family were given more weight.
States were ranked within each metric, earning a score based on the weighted value. States were then graded on a 100-point scale, with 100 points representing the most favorable conditions for mothers in the workforce.
State of Childcare - Total 25 Points
- School System Quality (6 points)
- Note: This metric measures student success rates, student safety, and school quality.
- Parental Leave Policies (6 points)
- Child Care Gap (6 points)
- Note: This metric measures the number of children in need of daycare and the number of available spots in each state.
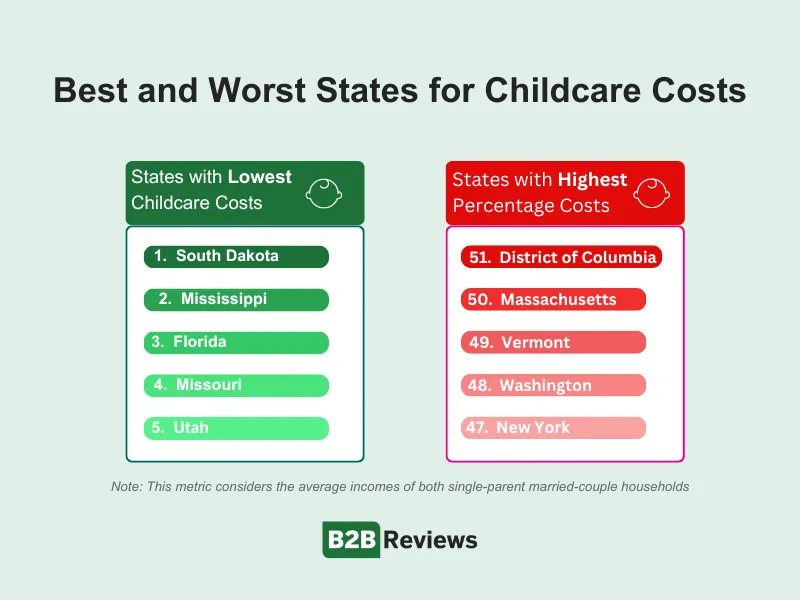
- Cost of Childcare (7 points)
- Note: This metric considers the average incomes of both single-parent married-couple households.
Job Market - Total 25 Points
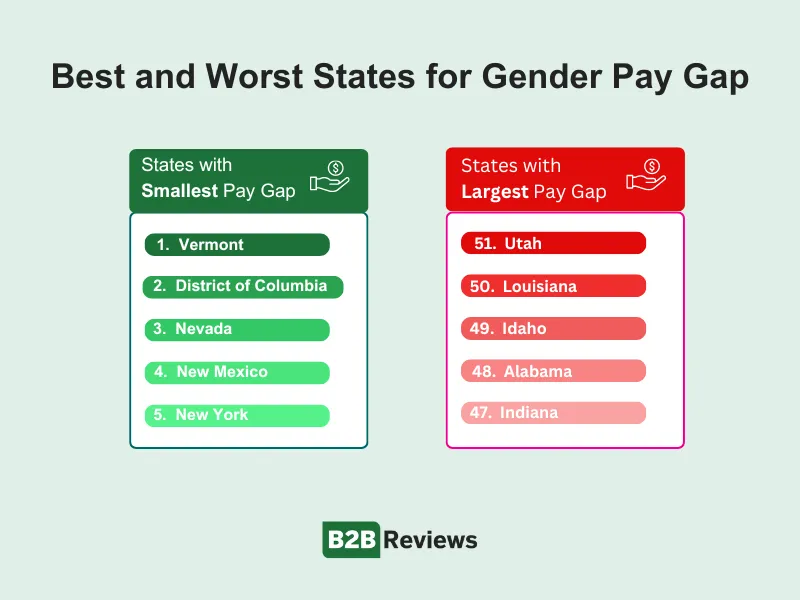
- Gender Pay Gap (6 points)
- State Unemployment Rate (6 points)
- State Employment Growth YoY (6 points)
- Minimum Wage (7 points)
Work-Life Balance & Health - Total 25 Points
- Percentage of Remote Work Opportunities (6 points)
- Average Work Week (7 points)
- Note: States with lower average work hours per week scored higher.
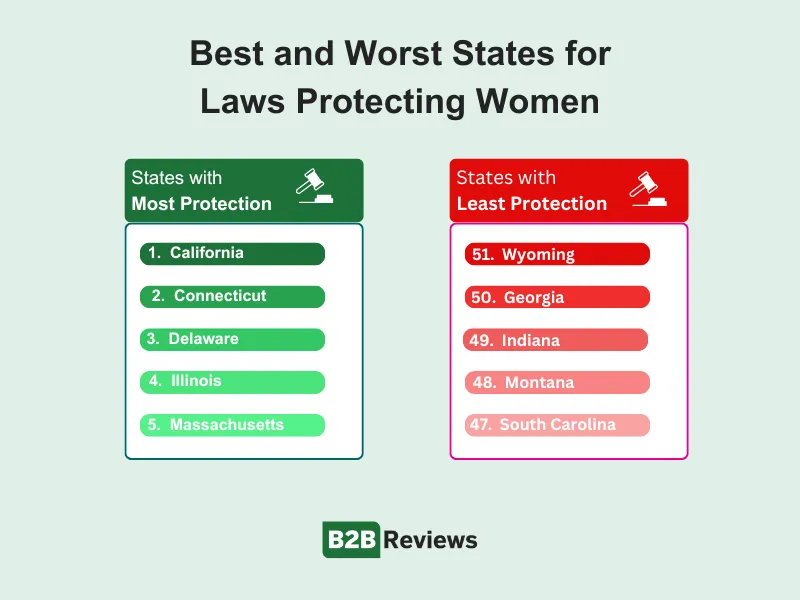
- Protections for Women (5 points)
- Note: This metric considers state-level laws and protections for women against sexual harassment. States earned additional points if they required training and added extra regulations.
- Overall Health/Wellbeing (7 points)
- Note: This metric considers the percentage of women who report poor health status, rates of uninsured women, and state depression rates.
Cost of Living - Total 25 Points
- Average Grocery Run (6 points)
- Average Income (7 points)
- Average Rent (6 points)
- State Income Tax (6 points)
- Note: This metric measures state income tax as a percentage of the average household income.
The Bottom Line
“Regardless of state involvement, companies have the ability to adapt policies and procedures that support working mothers,” Dege says. “This may require creativity in the form of collaboratives or partnerships across corporations to involve employers of all sizes. Companies need to recognize that these basic factors weigh heavily on the female leadership pipeline. We can’t ignore the factors that are breaking rungs on the leadership ladder and leap to a desire for equity at the c-suite level.”
Working moms face many struggles, whether in seeking professional opportunities or raising their families. However, it is not an unsolvable problem. Companies can review their policies to ensure they’re providing adequate support.
Additionally, working mothers can learn how to prioritize aspects of their lives to avoid burnout, taking ownership of what is immediately within their control, as Dege says.
Fair Use Statement
With Mother’s Day fast approaching, share our findings with the working moms you know so they can see how their state ranked in this new report. You can also share this for noncommercial purposes, but we ask that you provide a link back to this page so readers have access to our full research and findings.
Data used to create our rankings were collected from the following sources:
- Annuity.org. “Average Paid Maternity Leave by State: 2024 Statistics." Accessed April 17th, 2024.
- Bipartisan Policy Center. “National and State Child Care Data Overview.” Accessed April 17th, 2024.
- Centers for Disease Control and Prevention. “BRFSS Prevalence & Trends Data—-Depression.” Accessed April 18th, 2024.
- KFF. “U.S. Women's Health Status Data.” Accessed April 17th, 2024.
- National Conference of State Legislatures. “Sexual Harassment in the Workplace.” Accessed April 18th, 2024.
- National Women's Law Center. “The Wage Gap, State by State.” Accessed April 17th, 2024.
- Scholaroo. "2023 State Education Rankings—Best to Worst." Accessed April 17th, 2024.
- SelectSoftware Reviews. “New Data Reveals the Work from Home Hotspots Across the U.S.” Accessed April 17th, 2024.
- Tax Foundation. “State Individual Income Tax Rates and Brackets, 2024.” Accessed April 17th, 2024.
- U.S. Bureau of Labor Statistics. “State and Metro Area Employment, Hours, & Earnings.” Accessed April 17th, 2024.
- U.S. Bureau of Labor Statistics. “Unemployment Rates for States.” Accessed April 18th, 2024.
- U.S. Department of Labor. "Consolidated Minimum Wage Table.” Accessed April 17th, 2024.
- World Population Review. “Average Rent by State 2024.” Accessed April 17th, 2024.
- World Population Review. “Child Care Costs by State 2024.” Accessed April 18th, 2024.
- World Population Review. “Grocery Prices by State 2024.” Accessed April 17th, 2024.
- World Population Review. “Job Growth by State 2024.” Accessed April 17th, 2024.
- World Population Review. “Median Household Income by State 2024.” Accessed April 18th, 2024.
