We may earn money when you click on links to our partners. Advertiser Disclosure
Key Findings
- Alaska has the highest percentage of Native-owned businesses at 11.13%.
- At 53.78%, Hawaii has the highest ratio of Native-owned businesses compared to the Native community.
- Idaho had the highest percentage increase of Native American-owned businesses from 2022 to 2023 at 460%.
- Oklahoma has the highest estimated percentage of workers employed by Native American-owned businesses.
- The national average percentage of Native American-owned businesses is 1.39%.
Every November, Native American Heritage Month honors the “traditions, languages, and stories of Native American, Alaska Native, Native Hawaiian, and affiliated Island communities,” preserving and celebrating their history and contributions. This is a time not only to reflect on the cultural significance of these communities but also to recognize the unique challenges and successes of Native American entrepreneurs.
Zac Carman, CEO of ConsumerAffairs and a member of the Kaw Tribe, explains, “For Indigenous-owned businesses, success goes beyond profits. It’s about creating opportunities within our communities and preserving our culture through entrepreneurship.” Native American entrepreneurs drive impact and growth, contributing $46.3 billion annually to the U.S. economy across approximately 341,064 businesses.
Yet, Native American business owners still face hurdles. Carman notes, “We’ve come a long way, but challenges like access to funding, mentorship, and resources remain hurdles that many Indigenous-owned businesses continue to overcome.” This resilience, he adds, is rooted in cultural heritage and a drive to build sustainable businesses that benefit Native American communities and beyond.
In celebration of Native American Heritage Month, B2B Reviews analyzed small business data to identify where Native American-owned (NAO) businesses are thriving the most. Our ranking evaluates all 50 states and the District of Columbia across four key metrics important to Native American-owned businesses.
For details on our methodology and metrics, check out the methodology section below.
Best States for Native American-Owned Small Businesses Ranked
Sort the table below to see overall state rankings and state data by category.
Table lists overall rankings as well as percentages of each metric by state.
Top 10 Best States for Native-Owned Small Businesses
Discover why these states ranked in the top ten on our list.
1. Oregon
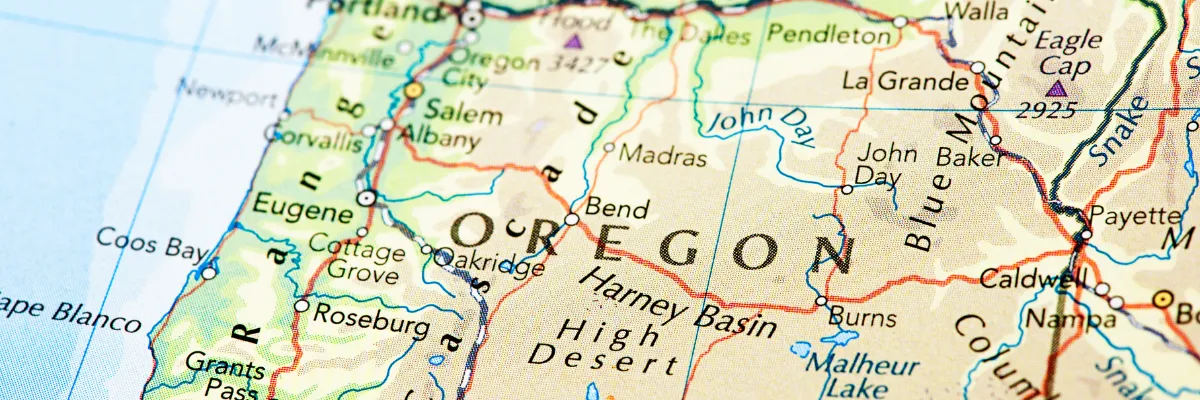
Oregon tops the list of best states for Native American-owned small businesses, ranking well in each category. It ranks in the top ten states for the percentage of NAO businesses and the estimated percentage of workers employed by Native-owned businesses.
- Percent of Native-Owned Businesses: 1.48%
- Ratio of NAO Businesses to Native Population: 9.35%
- NAO Business Percent Increase: 7.95%
- Percentage of Workers Employed by NAO Businesses: 0.87%
2. North Carolina
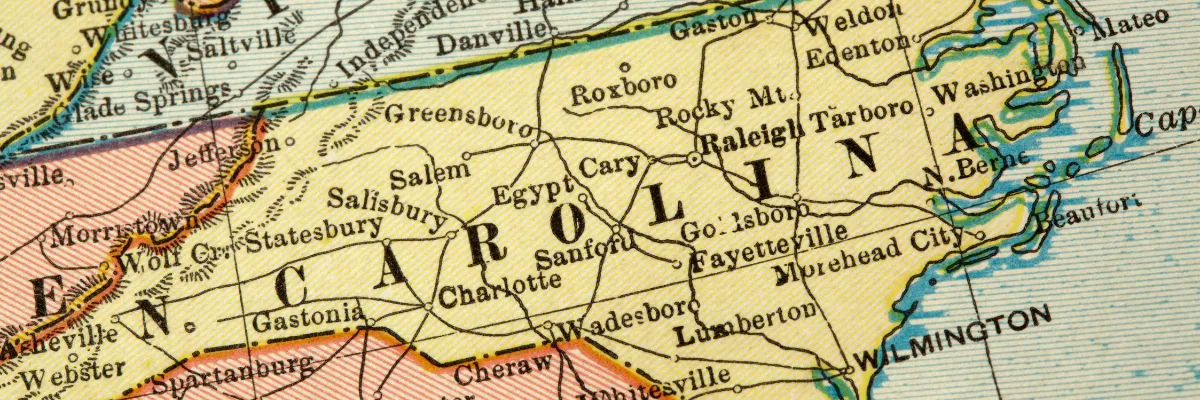
North Carolina came in second place on our list. Around 1.35% of all businesses in North Carolina are Native American-owned, and between 2022 and 2023, those businesses more than doubled, increasing by 273.97%.
- Percent of Native-Owned Businesses: 1.35%
- Ratio of NAO Businesses to Native Population: 10.35%
- NAO Business Percent Increase: 273.97%
- Percentage of Workers Employed by NAO Businesses: 0.58%
3. Hawaii
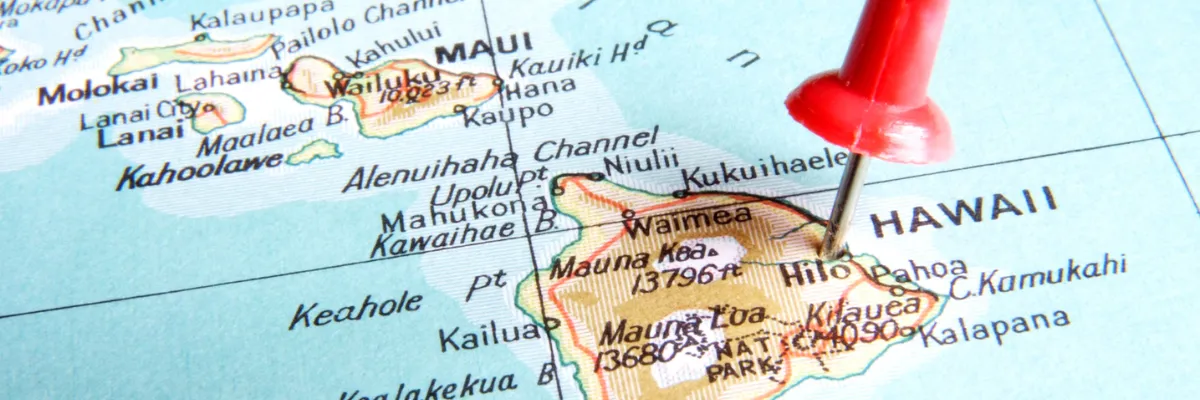
Hawaii took third place overall but ranked first for its ratio of Native-owned businesses to the Native community at 53.78%. This provides us with an indication of how active the native population is in the business community. Also, Hawaii was within the top ten states in terms of percent of native-owned businesses.
- Percent of Native-Owned Businesses: 1.75%
- Ratio of NAO Businesses to Native Population: 53.78%
- NAO Business Percent Increase: 262.10%
- Percentage of Workers Employed by NAO Businesses: 0.17%
4. Arkansas
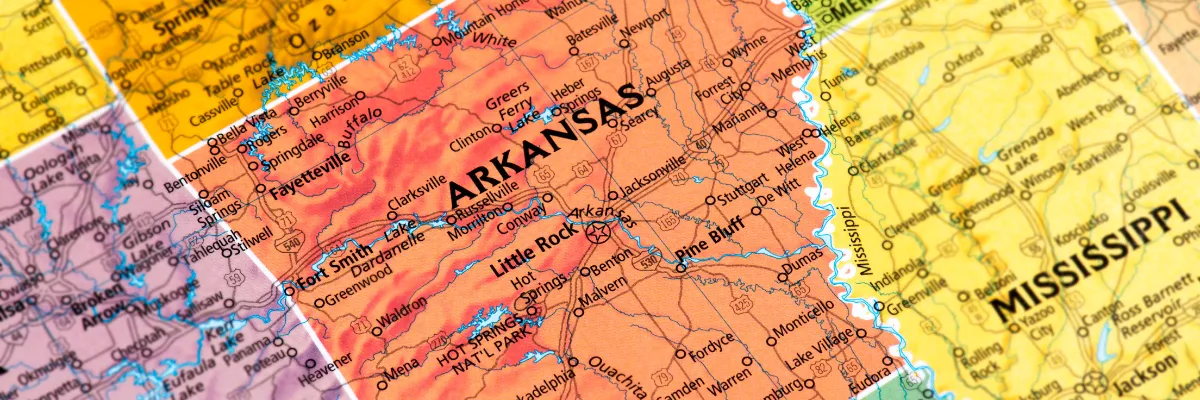
Coming in at fourth place, Arkansas saw a 248.99% increase in Native American-owned small businesses, and it has a higher-than-average percentage of Native-owned businesses within the state (excluding Alaska).
- Percent of Native-Owned Businesses: 1.29%
- Ratio of NAO Businesses to Native Population: 12.69%
- NAO Business Percent Increase: 248.99%
- Percentage of Workers Employed by NAO Businesses: 0.54%
5. Oklahoma
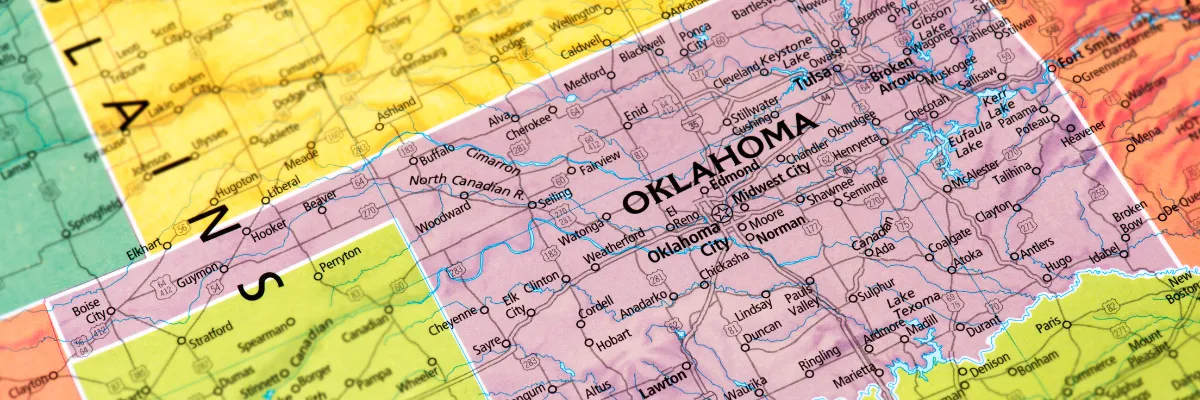
Oklahoma takes fifth place overall, but it comes in first for the estimated percentage of workers employed by a Native-owned business, with 6.60% of all Oklahoma workers employed by NAO businesses. Additionally, it ranked second for the percentage of Native-owned businesses within the state at 8.91%. The state’s smaller percentage increase of NAO businesses brought it down to fifth place.
- Percent of Native-Owned Businesses: 8.91%
- Ratio of NAO Businesses to Native Population: 9.95%
- NAO Business Percent Increase: 183.69%
- Percentage of Workers Employed by NAO Businesses: 6.60%
6. Nevada
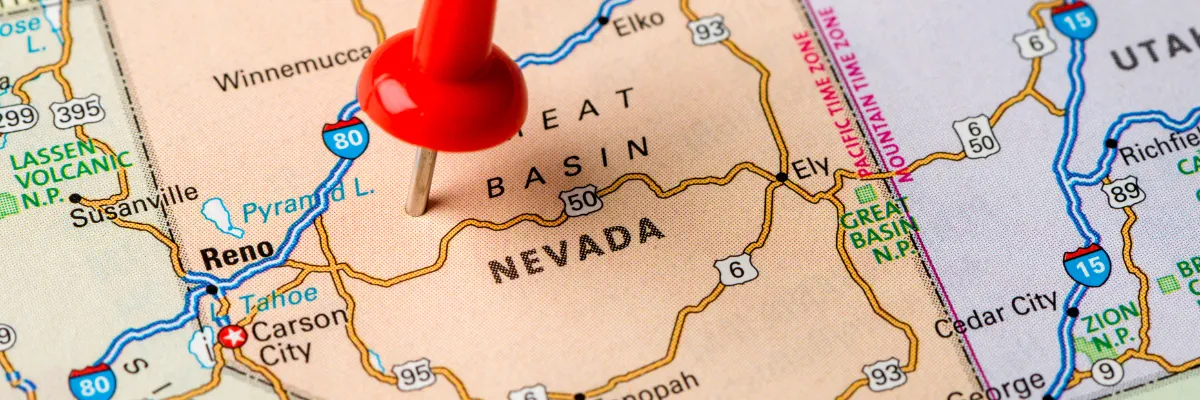
Nevada takes sixth place because of its higher-than-average percentage of NAO businesses, more than double the percent increase of those businesses from 2022 to 2023. Additionally, an estimated 0.57% of all Nevada workers are employed by Native American-owned small businesses.
- Percent of Native-Owned Businesses: 1.29%
- Ratio of NAO Businesses to Native Population: 9.21%
- NAO Business Percent Increase: 276.47%
- Percentage of Workers Employed by NAO Businesses: 0.57%
7. Idaho
Seeing the largest increase at 460% of Native American-owned businesses between 2022 and 2023, paired with a decent percent of Native businesses and community participation, Idaho takes seventh place for best states this month.
- Percent of Native-Owned Businesses: 1.19%
- Ratio of NAO Businesses to Native Population: 8.74%
- NAO Business Percent Increase: 460.00%
- Percentage of Workers Employed by NAO Businesses: 0.42%
8. West Virginia
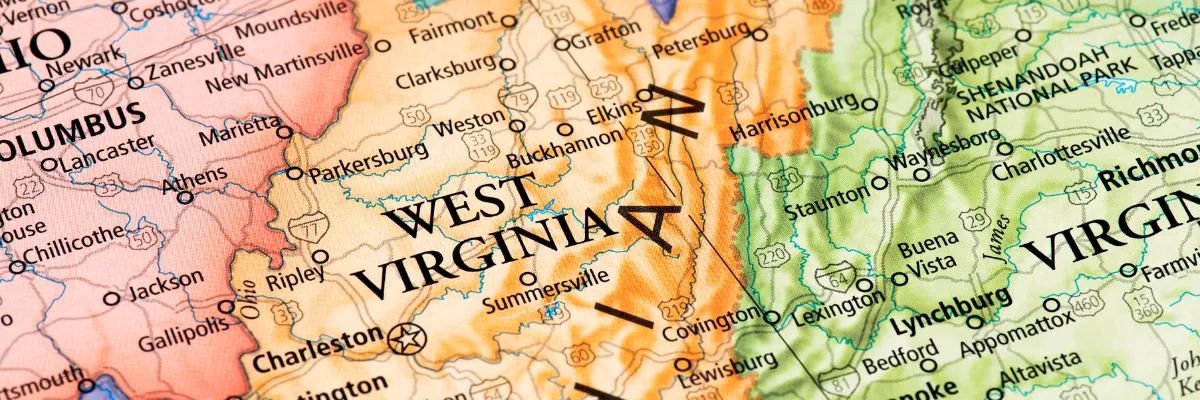
West Virginia claims spot number eight with its high percent increase of Native American-owned businesses. Between 2022 and 2023, NAO businesses increased by 362.96%. It also has a higher-than-average ratio of NAO businesses compared to the Native community at 13.49%.
- Percent of Native-Owned Businesses: 0.46%
- Ratio of NAO Businesses to Native Population: 13.49%
- NAO Business Percent Increase: 362.96%
- Percentage of Workers Employed by NAO Businesses: 0.68%
9. Washington
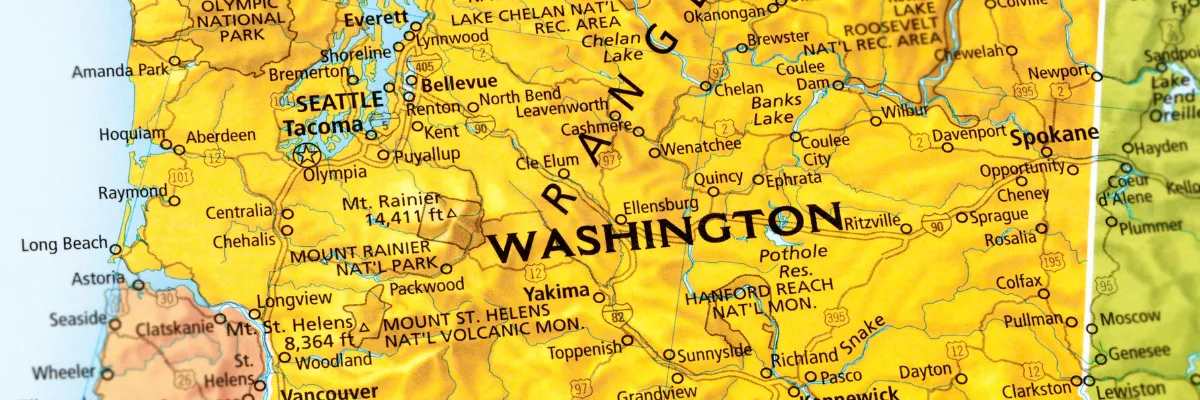
Our ninth-place winner is Washington State. It ranked within the top ten for two categories, securing its position on our list. It has a higher-than-average percentage of Native-Owned Businesses at 1.45% and came in seventh for the estimated percentage of workers employed by NAO businesses at 1.12%.
- Percent of Native-Owned Businesses: 1.45%
- Ratio of NAO Businesses to Native Population: 7.71%
- NAO Business Percent Increase: 235.78%
- Percentage of Workers Employed by NAO Businesses: 1.12%
10. New Mexico
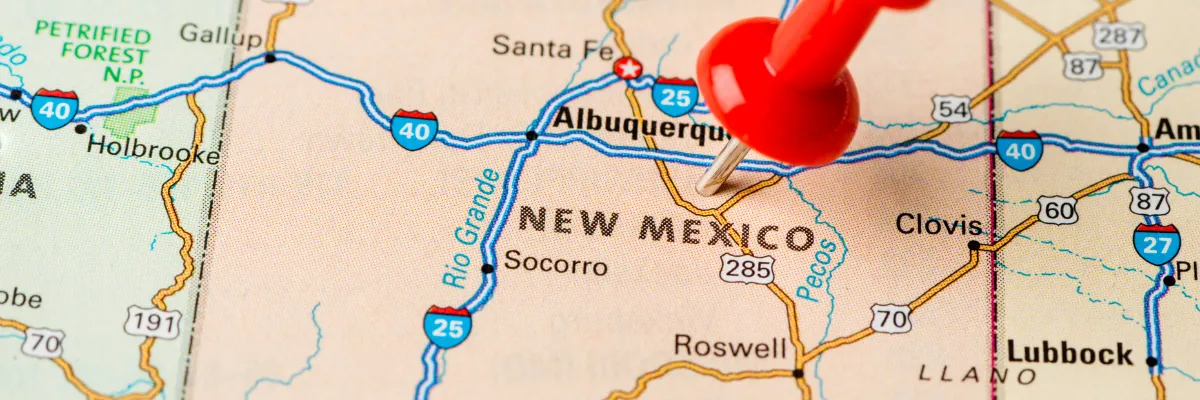
New Mexico completes our top ten list, but it also scores high within individual categories. Coming in third for the percentage of Native-Owned businesses, 5.68% of all New Mexico businesses are Native-owned. Additionally, an estimated 1.15% of all workers in New Mexico are employed by Native-owned businesses.
- Percent of Native-Owned Businesses: 5.68%
- Ratio of NAO Businesses to Native Population: 4.24%
- NAO Business Percent Increase: 238.70%
- Percentage of Workers Employed by NAO Businesses: 1.15%
Top States Within Key Metrics
The above list shows the states’ overall rank; however, some states stood out in each category.
Percentage of NAO Businesses
- Alaska wins first place in this category. Of all small businesses, 11.13% are Native-owned. This is almost ten points more than the national average.
- Oklahoma takes second place, with 8.91% of small businesses being Native-owned.
- New Mexico comes in third, with 5.68% of small businesses being Native-owned.
Sort the chart below to see how your state ranked.
Ratio of NAO Businesses to Native Population
- Hawaii takes the top spot with a 53.78% ratio of Native American-owned (NAO) businesses to the native population.
- New Hampshire comes in second with a 20.46% ratio of NAO businesses to the native community.
- Vermont follows close behind at 19.66% ratio of NAO businesses.
Sort the chart below to see your state’s rank.
Percent Increase of NAO Businesses
- Idaho comes first, seeing the largest increase of NAO businesses from 2022 to 2023 at 460%.
- New Hampshire scores second place again with a 429.91% increase in NAO businesses.
- Ohio claims third, with a 390% increase in NAO businesses.
Take a look at how your state did below.
Percentage of Workers Employed by NAO Businesses
- Oklahoma wins first place, with an estimated 6.60% of workers employed by NAO business.
- Alaska takes second, with an estimated 3.33% of all workers employed by NAO businesses.
- Alabama scores third place, with NAO businesses employing an estimated 1.28% of all workers.
See how your state ranked using the chart below.
Methodology
To determine which states Native American-owned small businesses are thriving in, the B2B Reviews research team compared all 50 states and the District of Columbia across four key metrics.
The metrics looked at the percentage of NAO businesses within the state, the ratio of NAO businesses to the local Native community, the percent increase of NAO businesses from 2022 to 2023, and the estimated percent of workers employed by Native-owned businesses.
States were ranked within these metrics, earning a score based on the weighted value. We then graded them on a 100-point scale, with 100 points representing the states where Native American-owned businesses are thriving.
Below is a breakdown of each metric and the total number of points a state could earn for that category.
Percent of Native-Owned Businesses - Total Points 25
The B2B Reviews research team gathered the total number of small businesses in each state and found how many are Native-owned using SBA data. Then, we determined the percentage of Native-owned businesses. States with a more significant percentage of NAO businesses scored higher.
Ratio of Native American-Owned Businesses to the Native Population - Total Points 25
To find the ratio of NAO businesses to the native population, we compared the number of NAO businesses to the total Native population within each state. This percentage indicates how active the native population is in the business community. States with a higher ratio scored better.
Native American-Owned Businesses Percent Increase - Total 25 Points
To find the percent increase, we gathered the number of Native American-owned small businesses in 2022 and 2023. We then calculated the difference and determined the percent increase. We assigned higher scores to states with more significant growth.
Percentage of Workers Employed by Native American-Owned Businesses - Total 25 Points
Using Census Bureau data, we collected the number of employees and determined the estimated number of workers employed by Native-owned businesses in each state. We then compared these numbers to determine the percentage. States where NAO businesses employed a higher percentage of workers scored more points.
The Bottom Line
With 341,064 businesses contributing $46.3 billion yearly, Native American-owned small businesses are important to the American economy and help spread wealth within native communities. However, there’s plenty of opportunity and room for growth within the Native business community.
This National Native American Heritage Month, we encourage consumers to make an effort to support local Native-owned businesses to promote business health and growth:
- Buy from Native-Owned Businesses: When buying gifts, clothes, or other products, seek out Native-owned businesses. Buying products directly ensures that the full economic benefits go to that business rather than a third party.
- Leave Positive Reviews: In an age where reviews greatly impact purchasing decisions, leaving positive, honest, and thoughtful reviews on platforms like B2B Reviews, Google, Yelp, and other social media platforms significantly helps small businesses. Reviews build credibility, encouraging new customers to try a new vendor.
- Advocate for Policies that Support Native Businesses: To help improve funding, provide resources, and expand opportunities for Native-owned businesses, you can advocate for policies and initiatives focusing on these areas.
Consumers aren’t the only people who can help support local Native-owned businesses. In fact, Native business owners can take steps to raise awareness and boost sales during November and beyond.
- Promote Cultural Heritage: Take advantage of the month and share your unique stories, heritage, values, and more. Using tools like social media, websites, local events, and other platforms is a great way to raise awareness for both your business and your culture.
- Collaborate with Other Native-Owned Businesses: As the saying goes, two heads are better than one. Working with other Native entrepreneurs can cross-promote both companies’ products and services. It also builds your network and attracts new customers.
- Optimize Online Presence: The online world is arguably more important than the physical one when it comes to marketing. By optimizing your online presence and collecting customer reviews to gather feedback and showcase positive experiences, you can reach your ideal customer and increase revenue.
- Make sure your website is up-to-date and user-friendly, directing customers to revenue-driving pages.
- Utilize social media and build a company identity and voice. Use relevant hashtags, run digital campaigns, offer special promotions, and be transparent with consumers.
Supporting Native American-owned businesses helps create a diverse business community and strengthens local communities and economies. This Native American Heritage Month, we encourage you to make an effort to support Native businesses.
Fair Use Statement
If you found our findings insightful and wish to share them, please do so for non-commercial purposes only and provide a link to this report so readers can access our full methodology.
Related Articles
- Best States for Hispanic-Owned Small Businesses
- Best States for Independent Retailers
- Best States for Black-Owned Businesses in 2024
Data used to create our rankings were collected from the following sources:
- Small Business Administration: Office of Advocacy, “Small Business Profiles for the States, Territories, and Nation 2022.” Accessed October 28th, 2024.
- Small Business Administration: Office of Advocacy, “Small Business Profiles for the States, Territories, and Nation 2023.” Accessed October 28th, 2024.
- United States Census Bureau, “Annual Business Survey: Receipts Size of Firm Statistics for Employer Firms by Industry, Sex, Ethnicity, Race, and Veteran Status for the U.S., States, and Metro Areas: 2021.” Accessed November 1st, 2024.
- United States Census Bureau, “Census Bureau Profiles Results.” Accessed November 1st, 2024.
